
Case Study
Every Call Counts: A 90,157-Call Reliability Study of Production AI Voice Agents
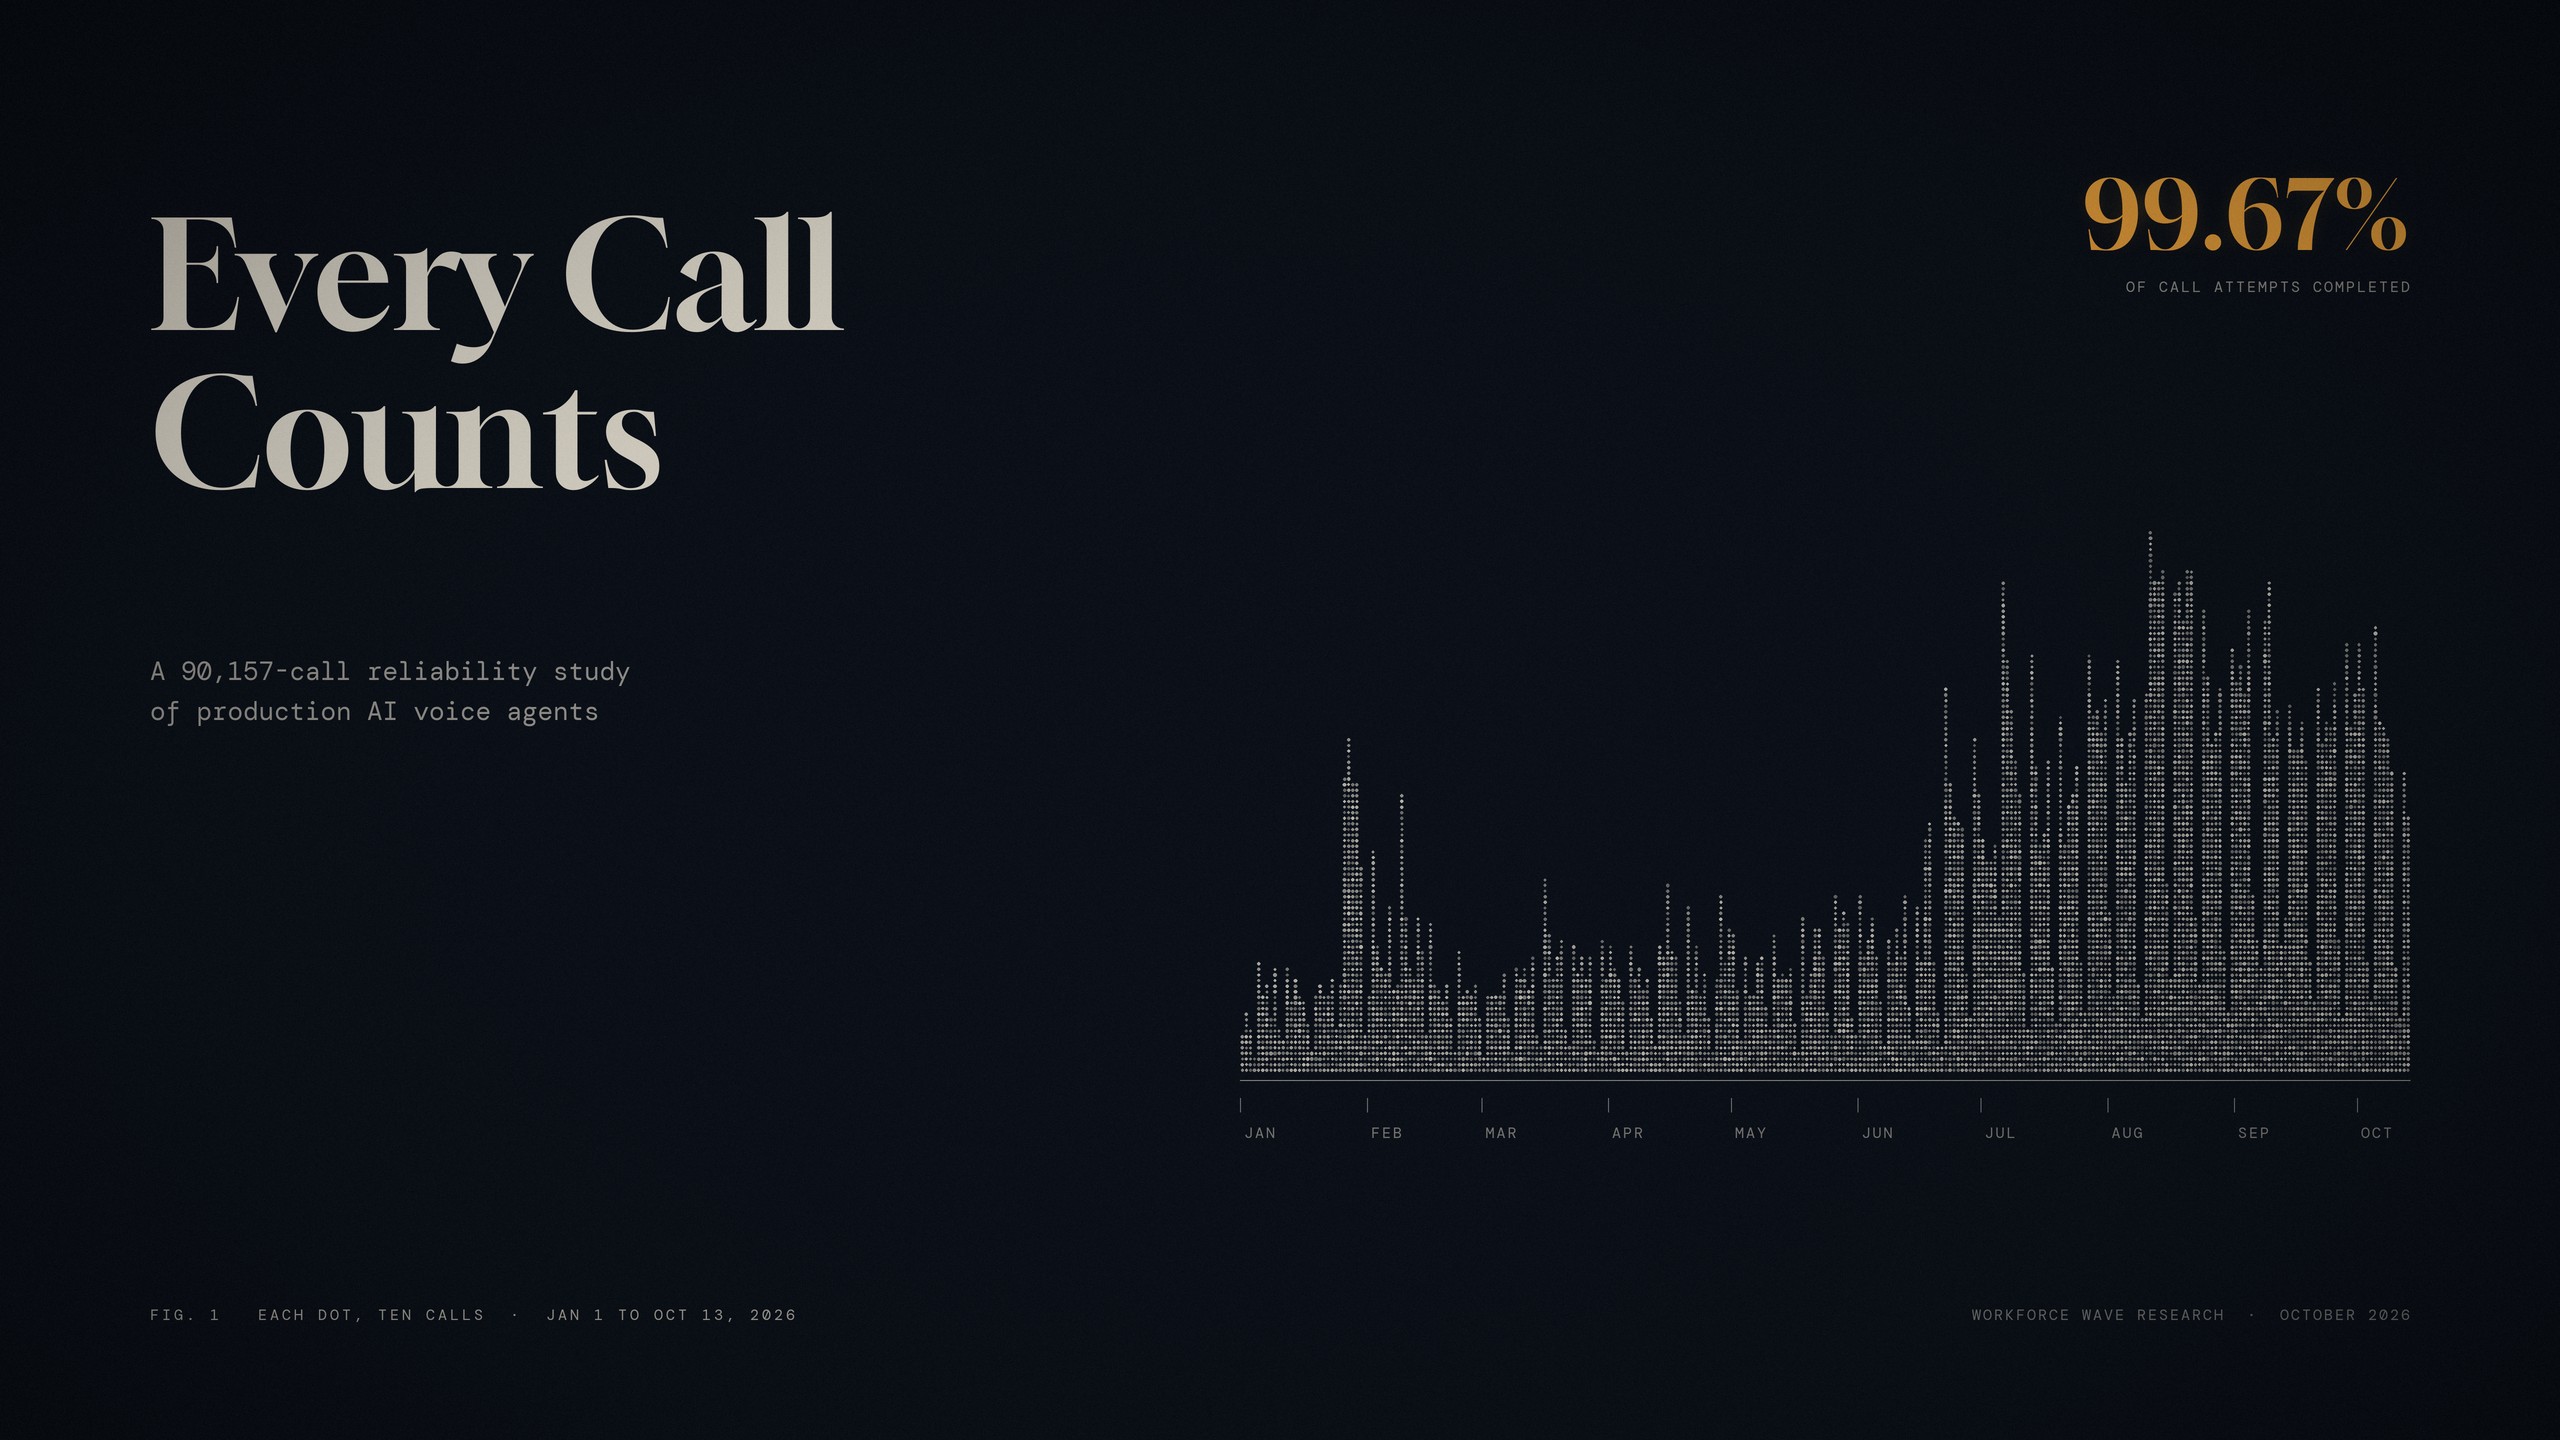
How often do calls to AI voice agents actually connect? A study of 90,157 call attempts to 71 production agents across five types of business line.
Your brand doesn't just use voice agents—it casts them.
Open the Workshop — Get a CallAbstract
Background. Phone systems and the cloud platforms behind them describe reliability as time-based availability, usually in contracts that exclude carrier faults, short interruptions and third-party speech and AI providers. No published study reports how often calls to production AI voice agents actually connect and complete. That is the number a caller experiences.
Methods. We analyzed every inbound phone call to 71 production AI voice agents serving 57 organizations between January 1 and October 13, 2026. The primary outcome was attempt-based call success: the share of call attempts that completed without a failure on the service side. Every failed attempt counted, including redials. Calls the caller abandoned in silence were excluded and reported. We report Wilson 95% intervals and a bootstrap interval that resamples days, because failures cluster in time.
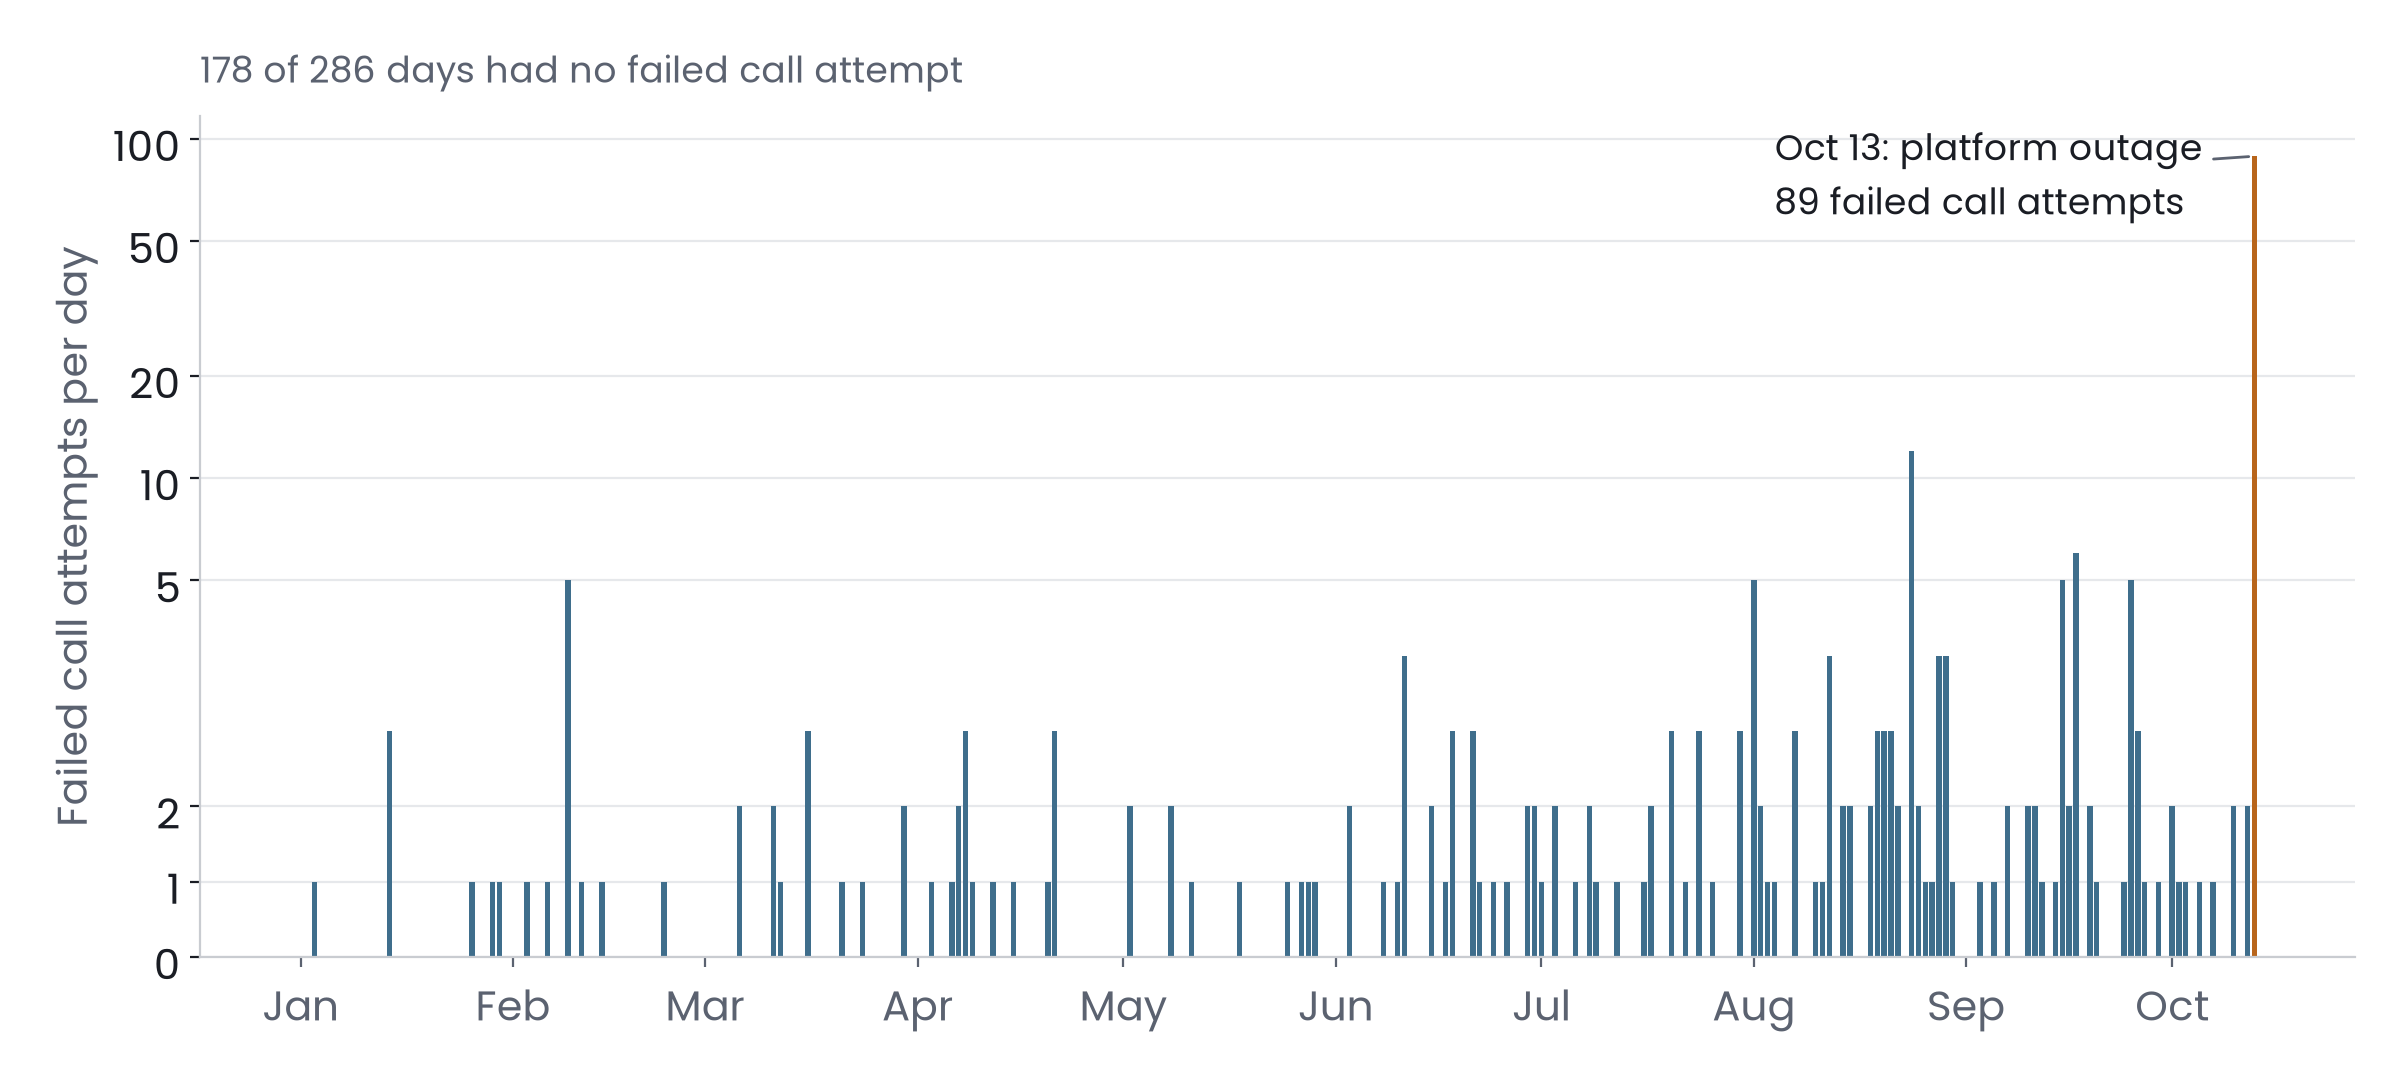
Results. Of 90,157 call attempts, 89,862 completed (99.67%, 95% CI 99.63 to 99.71, day-resampled 99.45 to 99.80). The median day had no failures, and 178 of 286 days had none at all. The largest single event, a two-hour outage at a provider beneath the voice platform on October 13, accounted for 89 failed attempts. Outside that day the fleet completed 99.77% of attempts. Time-based availability for the period was 99.97%.
Conclusions. Call-level reliability of AI voice agents in this fleet was high across every line type, and most days passed without a single failed call. Measuring calls rather than uptime gives operators and buyers a figure that matches what callers experience.
1. Introduction
The telephone industry's reference point for reliability is "five nines," 99.999% availability. The figure began as a Bell System design objective for a single switch, about three minutes of failure a year. Bellcore's own objective for a whole local exchange network was 99.93%, and the best public measurement of the US network, an analysis of FCC outage reports from 1992 to 1994, averaged availability across customers and counted only outages affecting 30,000 or more of them [1].
Modern communications platforms report reliability the same way. Service level agreements for cloud telephony and contact-center platforms promise between 99.95% and 99.999% of time available, measured for the vendor's own component. Twilio's agreement, for example, excludes carrier issues, maintenance and outages shorter than five continuous minutes [2]. Five9 advertises 99.999% but pays its first credit only below 99.99%, and excludes its speech-synthesis and language-understanding providers [3]. None of these agreements commits to a share of calls connected.
An AI voice agent depends on a chain of services: the carrier, the telephony provider, the voice platform, a language model, speech recognition and speech synthesis. Availability of a chain is roughly the product of its links, and Google's reliability engineers advise that each critical dependency needs one more nine than the service built on it [4]. Six links at 99.9% each multiply to about 99.4%.
Callers do not experience availability. They experience a call that connects or does not. This study measures that directly across a production fleet.
2. Methods
2.1 Data source
Workforce Wave builds and operates AI voice agents that answer inbound calls for businesses and public agencies. Call records were drawn from the voice platform's conversation logs for January 1 through October 13, 2026 (286 days). Each record includes the agent, start time, duration, final status and, for calls that did not complete, a recorded reason. The extract contained 94,972 conversations across all channels.
2.2 Inclusion
We kept phone calls only. Agents were linked to client organizations through the Workforce Wave account database. We excluded agents with no client record, agents belonging to internal, testing or demonstration accounts, and agents whose names marked them as demonstrations, tests or copies, a total of 2,134 phone calls. The analysis set contained 90,238 phone calls answered by 71 agents for 57 organizations.
2.3 Outcome
The primary outcome was attempt-based call success: completed calls divided by completed calls plus calls that failed for a reason on the service side. Every failed attempt counted, so a caller who redialed five times during an outage contributed five failures. Calls that ended because the caller stayed silent for 60 seconds or disconnected without speaking (80 calls) were excluded and reported separately, as was one call that reached the maximum permitted duration. The final denominator was 90,157 attempts.
Because failures were recorded wherever they occurred, the outcome combines two properties that telecom standards separate [5]: accessibility, whether a call can be set up, and retainability, whether it continues once set up.
2.4 Failure categories
Each failed attempt was assigned to one category from its recorded reason: call setup, speech generation, AI model response, platform server error, or agent configuration. Agent configuration failures are errors on the operator's side and were counted against the service.
2.5 Line types
Organizations were grouped into five line types from their account records: municipal and public agency, home services, hospitality (restaurants, resorts and spas), health and care, and other.
2.6 Statistical analysis
We report proportions with Wilson score 95% intervals, which behave well near 100% where the common textbook interval does not [6]. Failures in operational systems cluster in time, so calls are not independent. We therefore also report a bootstrap interval that resamples whole days (5,000 replicates) and daily and monthly distributions. Time-based availability was computed from the duration of the one fleet-wide call-setup outage.
2.7 Privacy
Only call metadata and failure reasons were analyzed. No transcripts, caller telephone numbers or identities were used, and no client organization is named in this report.
3. Results
3.1 Overall
Of 90,157 call attempts, 89,862 completed, a call success rate of 99.67% (95% CI 99.63 to 99.71). Resampling days gave a wider interval of 99.45 to 99.80, reflecting how much a single day moves the total. Time-based availability, counting the 130-minute call-setup outage on October 13 against 286 days, was 99.97%.
| Scope | Attempts | Call success (95% CI) |
|---|---|---|
| All attempts | 90,157 | 99.67% (99.63 to 99.71) |
| Excluding October 13 | 89,696 | 99.77% (99.74 to 99.80) |
3.2 Over time
The median day had a 100% success rate, and 178 of 286 days had no failed attempt (Figure 1). Monthly success ranged from 99.67% to 99.88% before October. The one day that stood apart was October 13, when a provider beneath the voice platform had a two-hour outage and 89 attempts failed at call setup. Service returned to normal the same morning.
3.3 Failure categories
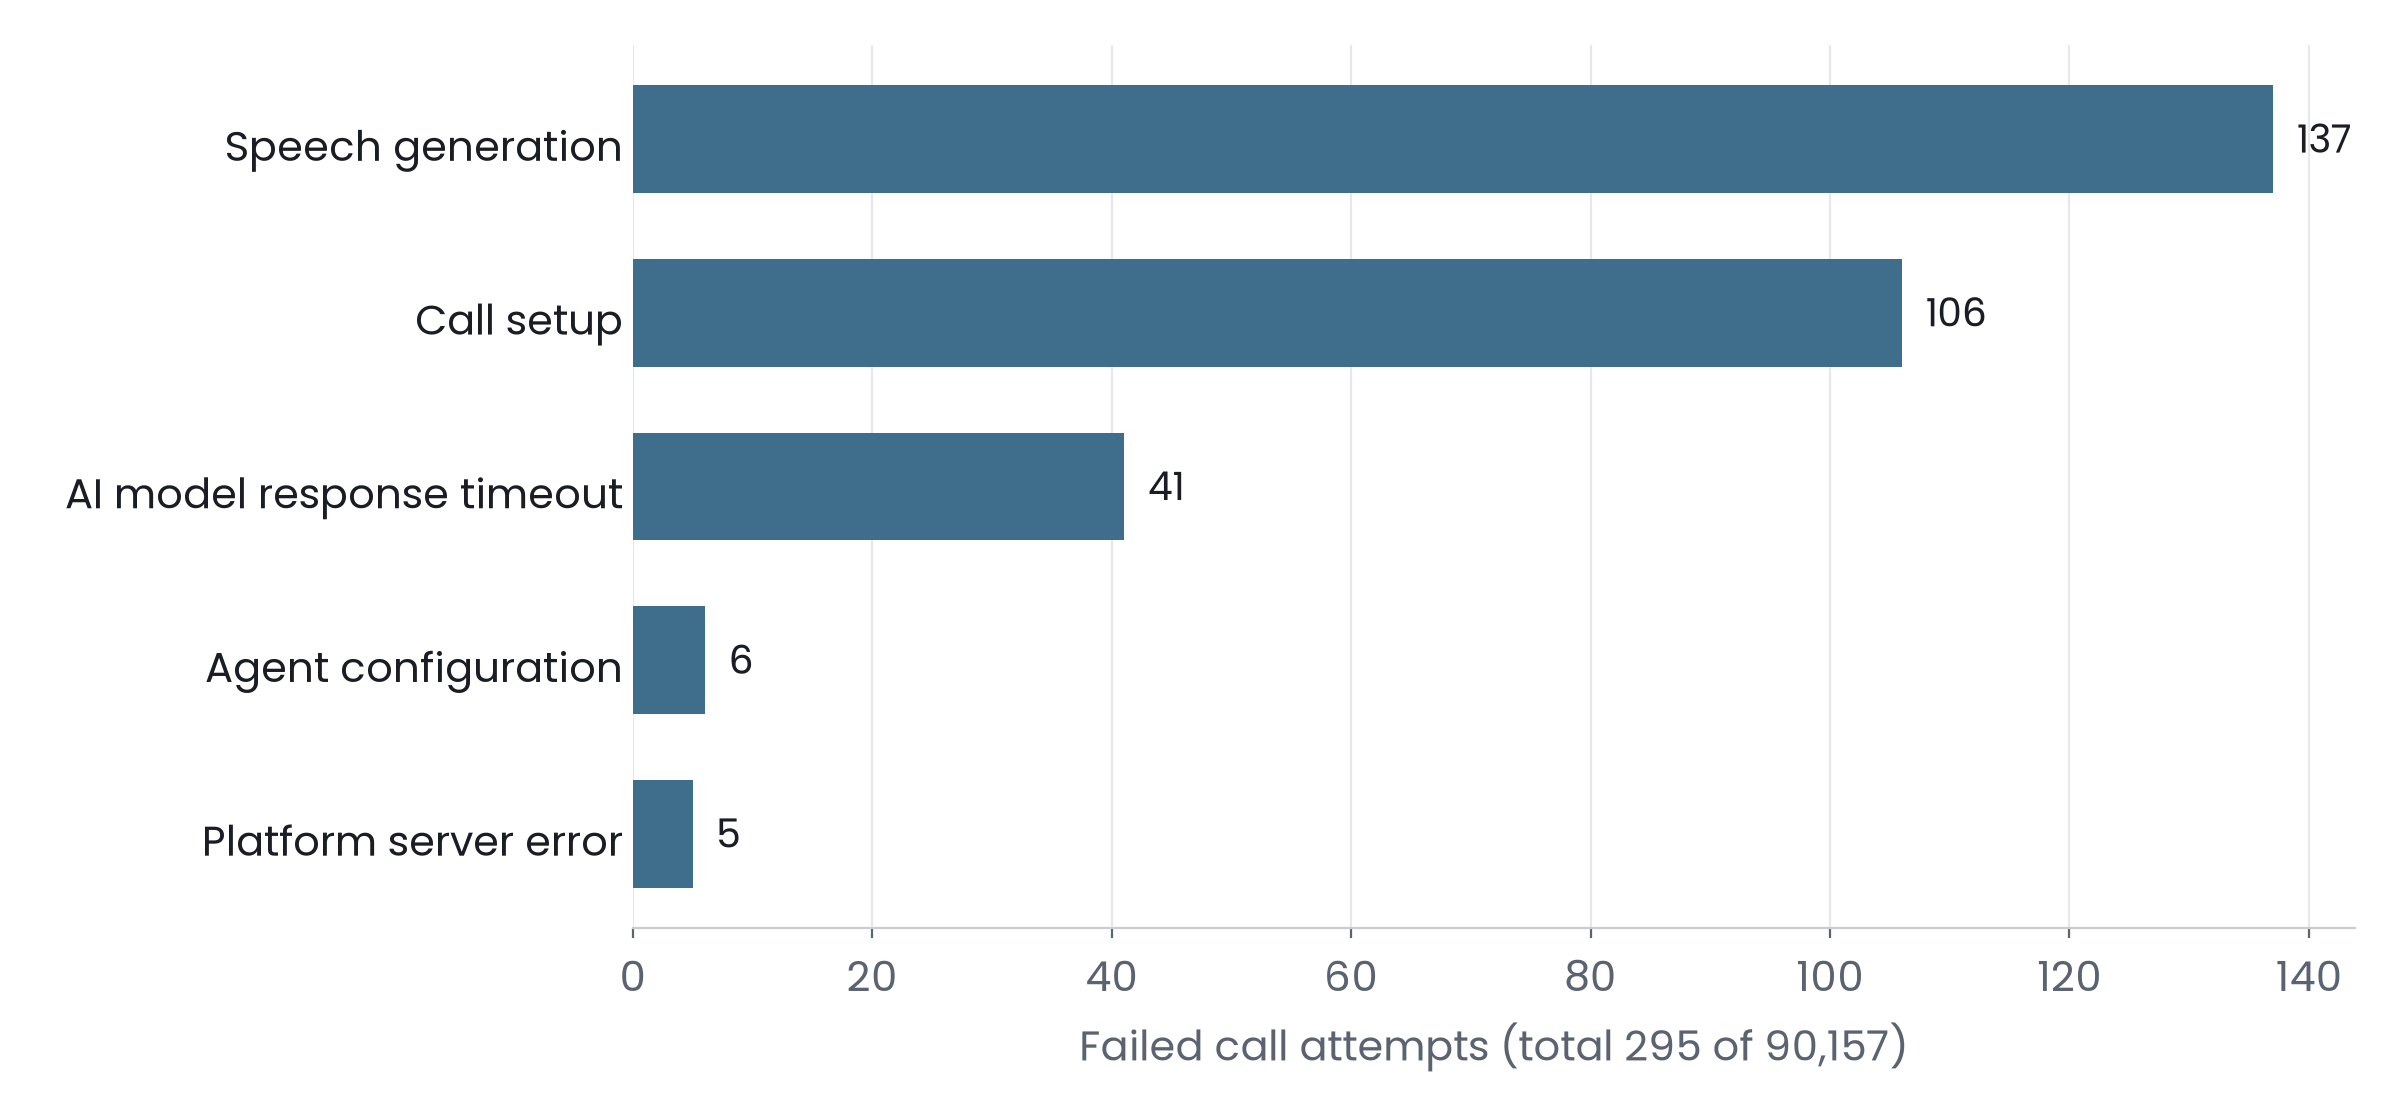
Across 286 days, 295 attempts failed: 137 in speech generation, 106 at call setup, 41 waiting on the AI model, 6 from agent configuration and 5 from platform server errors (Figure 2). Together they represent about one call in 300.
3.4 Line types and agents
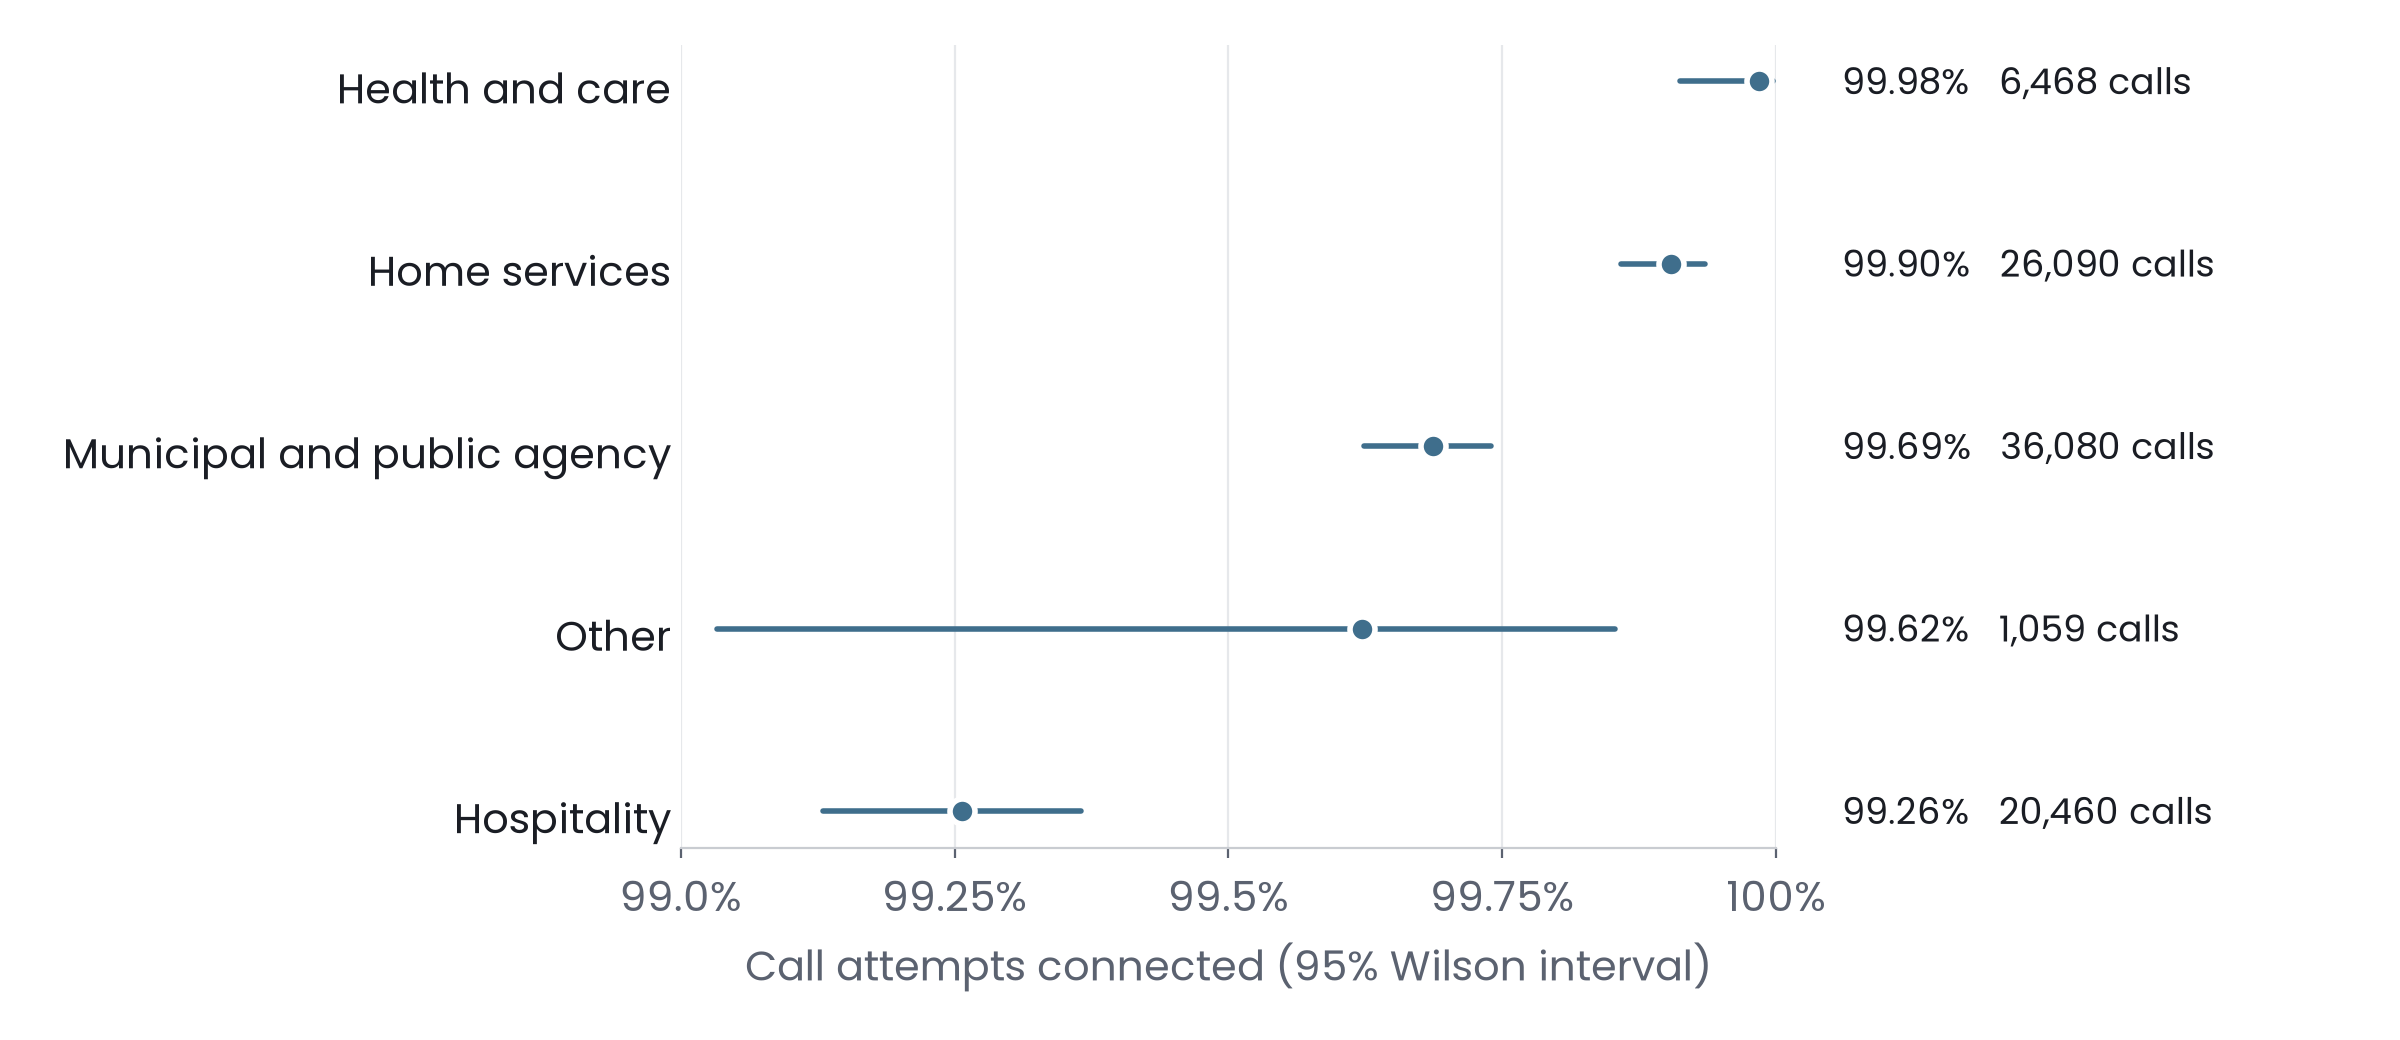
Every line type completed more than 99% of attempts. Health and care lines completed 99.98% (one failure in 6,468) and home-services lines 99.90% (Figure 3, Table 2).
| Line type | Agents | Attempts | Call success (95% CI) |
|---|---|---|---|
| Municipal and public agency | 23 | 36,080 | 99.69% (99.62 to 99.74) |
| Home services | 6 | 26,090 | 99.90% (99.86 to 99.94) |
| Hospitality | 21 | 20,460 | 99.26% (99.13 to 99.37) |
| Health and care | 5 | 6,468 | 99.98% (99.91 to 100.00) |
| Other | 16 | 1,059 | 99.62% (99.03 to 99.85) |
Of the 35 agents that handled at least 100 calls, 13 had no failures at all, and the median agent completed 99.89% of attempts.
3.5 Hospitality lines
Hospitality agents answered for 20 restaurants, resorts and spas served through a single hospitality partner, 20,460 call attempts in all. Of the 10 lines that handled at least 100 calls, half completed 99.8% or more, and a spa and a restaurant completed every call they received, 2,689 and 1,086 calls respectively. The 10 smaller lines handled 91 calls between them without a failure.
4. Discussion
Across more than 90,000 call attempts, AI voice agents in this fleet connected and completed 99.67% of the time, counting every failed redial against them, and 99.77% outside the one significant outage.
The comparison most often made is with five nines, and it does not hold up in either direction. Five nines describes time, for one component, under contractual exclusions. Our time-based figure, 99.97%, sits above Twilio's 99.95% contractual floor and Bellcore's 99.93% network objective, and below the 99.99% tier that Amazon Connect and Genesys Cloud contract for [1, 2, 7, 8]. Single outages elsewhere in the dependency chain lasted far longer: 12 hours for AT&T in February 2024, which blocked more than 92 million calls [9], and about 14.5 hours for an Amazon Web Services region in October 2025 [10].
The fairer comparison for a call-based figure is with call-based figures. Regulators set mobile call setup targets of 95% [11], testing commissioned in the UK found 92.6% to 97% of mobile calls connected [12], and the only published side-by-side measurement, now dated, found 99.9% of conventional landline calls and 96.9% of internet calls completed [13]. Figures for human-answered lines measure something different again, a person answering, and run from about 52% of calls to home-services businesses [14] to about 94% for a well-run city 311 center [15].
Telephony providers also let an operator route a call elsewhere when the service behind a number fails to answer [16]. For outages at call setup, like the one on October 13, that gives AI voice lines a backup path that a single human receptionist does not have.
5. Limitations
This is an observational study of one operator's fleet on one voice platform. The denominator comes from the platform's logs, which record calls that reached the platform, so a call that failed earlier inside a carrier would not appear. The study window ends on the day of the largest outage, which is counted in full. A call that connected but in which the agent performed poorly counts as a success here. Line types were assigned from account records and are approximate, and several contain few agents.
6. Practical implications
- Measure calls, and count every attempt. A time-based figure hides when outages land, and counting each caller once hides redials. Report attempt-based success first and the caller-based view beside it.
- Add fallback routing at the telephone number, hosted by the telephony provider and separate from the AI platform, so a failed connection reaches a person or a voicemail.
- Review failures by category on a fixed schedule, by agent and by month, so a pattern on any one line surfaces early.
Authors
Colin P. Highland and the Workforce Wave research team. October 2026.
Data availability
Aggregate tables and the analysis code are available from the authors on request. Call-level data are not shared, to protect clients and callers.
Conflict of interest
The authors work for Workforce Wave, which builds and operates the AI voice agents studied here. No external funding was received.
Suggested citation
Highland CP, Workforce Wave Research. Every Call Counts: A 90,157-Call Reliability Study of Production AI Voice Agents. Workforce Wave, October 2026.
References
- Kuhn DR. Sources of failure in the public switched telephone network. IEEE Computer 30(4), 1997. Full text
- Twilio. Service Level Agreement, Twilio APIs. 2026. twilio.com
- Five9. Service Level Agreement. five9.com
- Treynor B, Dahlin M, Rau V, Beyer B. The calculus of service availability. ACM Queue 15(2), 2017. queue.acm.org
- ITU-T Recommendation E.800. Terms and definitions related to quality of service and network performance. 1992 text
- Brown LD, Cai TT, DasGupta A. Interval estimation for a binomial proportion. Statistical Science 16(2):101-133, 2001. Project Euclid
- Amazon Web Services. Amazon Connect Service Level Agreement. aws.amazon.com
- Genesys. Genesys Cloud service level agreements. help.genesys.cloud
- Benton Institute. FCC report on the February 2024 AT&T wireless outage. benton.org
- Amazon Web Services. Summary of the Amazon DynamoDB service disruption in the Northern Virginia (US-EAST-1) Region, October 2025. aws.amazon.com
- Telecom Regulatory Authority of India. Quality of service standards press release, 2016. trai.gov.in
- Telecoms Tech News. Ofcom-commissioned mobile call connection testing. telecomstechnews.com
- InformationWeek. Voice over IP's quality surprise (Keynote Systems measurements). informationweek.com
- Invoca. Home services lead conversion benchmarks report, 2026. invoca.com
- City of New Orleans. ResultsNOLA, 311 call abandonment rate. datadriven.nola.gov
- Twilio. Availability and reliability, voice fallback URLs. twilio.com
Related Case Studies
The Opening Line: A 72,798-Call Study of Business Phone Greetings
Which phone greetings make callers hang up before they speak? An analysis of 72,798 calls to 89 AI voice agents across seven business types.
Thank You for Calling: The Science of the Phone Answering Script
What the research says about phone answering scripts, which greeting rules still work when an AI voice agent picks up, and a gold-standard script to copy.
Chroma Feralis: The Wild Mirror of Escalation
Chroma Feralis isn't a voice agent, she's a prompt come to life. Born from chaos, built for performance.